Amalur EIS: a system for calculating the environmental impacts of industrial sites from E-PRTR records
Environmental Monitoring and Assessment 197, 163 (11 January 2025)
https://doi.org/10.1007/s10661-024-13565-3
In this paper we present Amalur EIS as an Environmental Information System capable of estimating the environmental impact of emissions from point sources in European industry based on data provided by the European Pollutant Release and Transfer Register (E-PRTR) database.
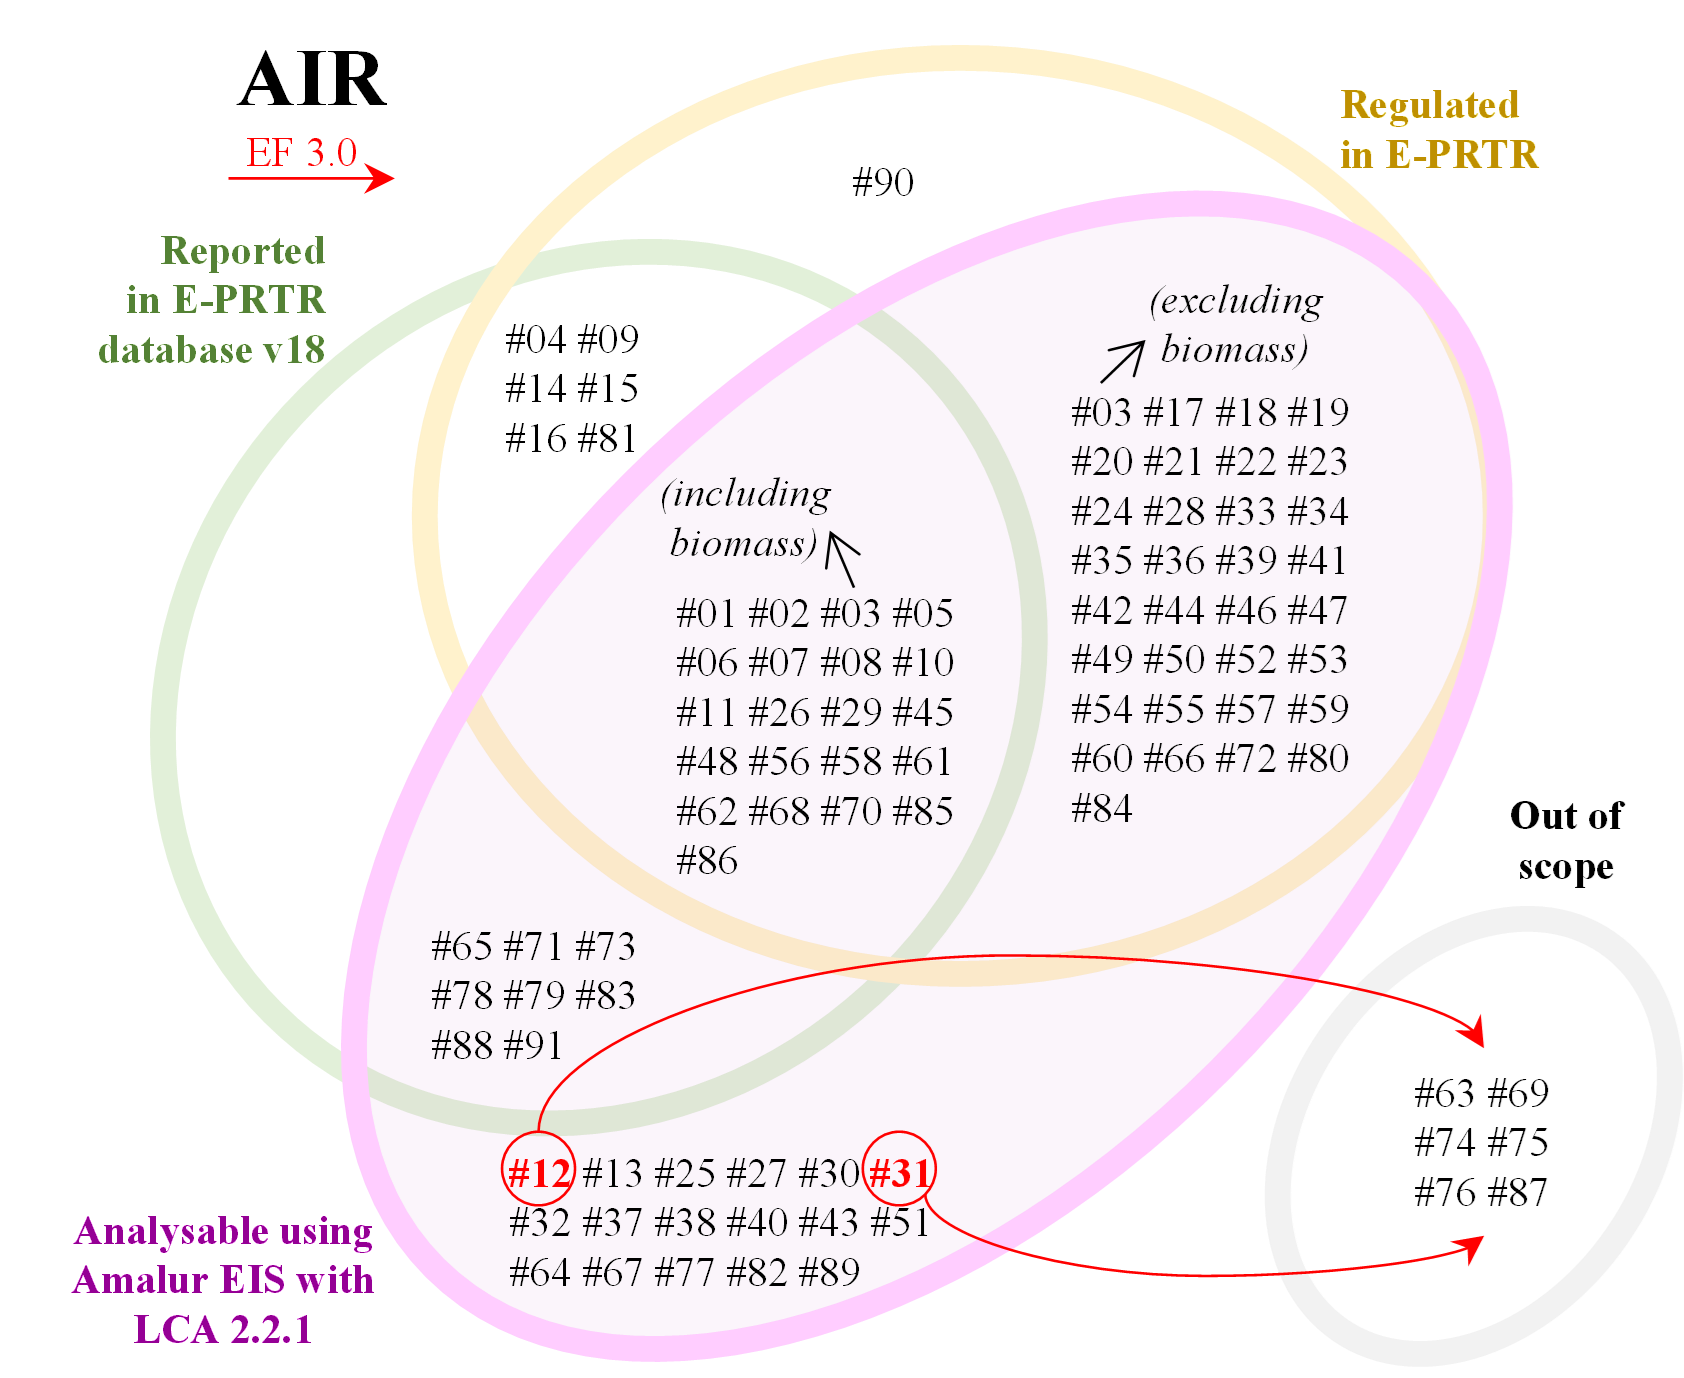
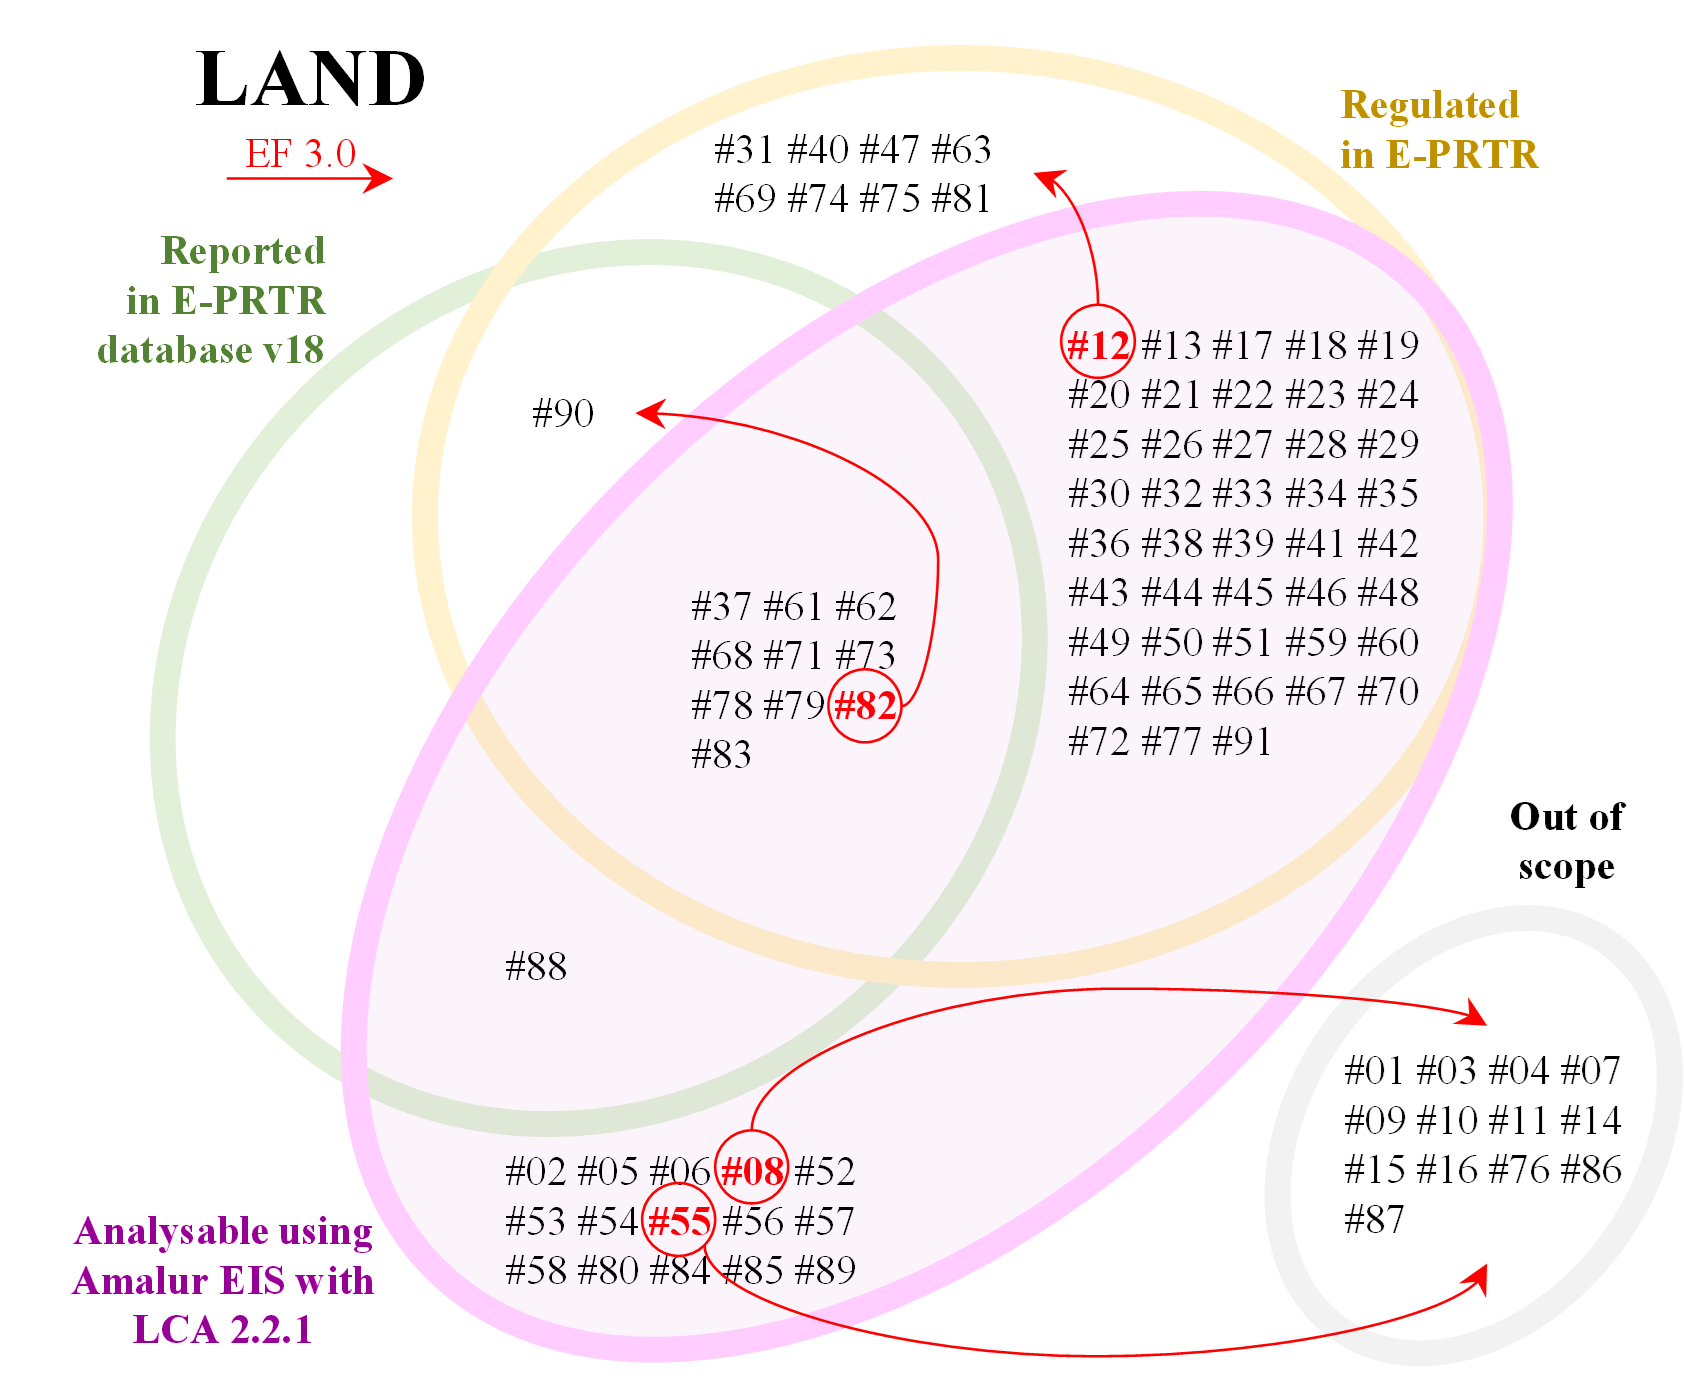
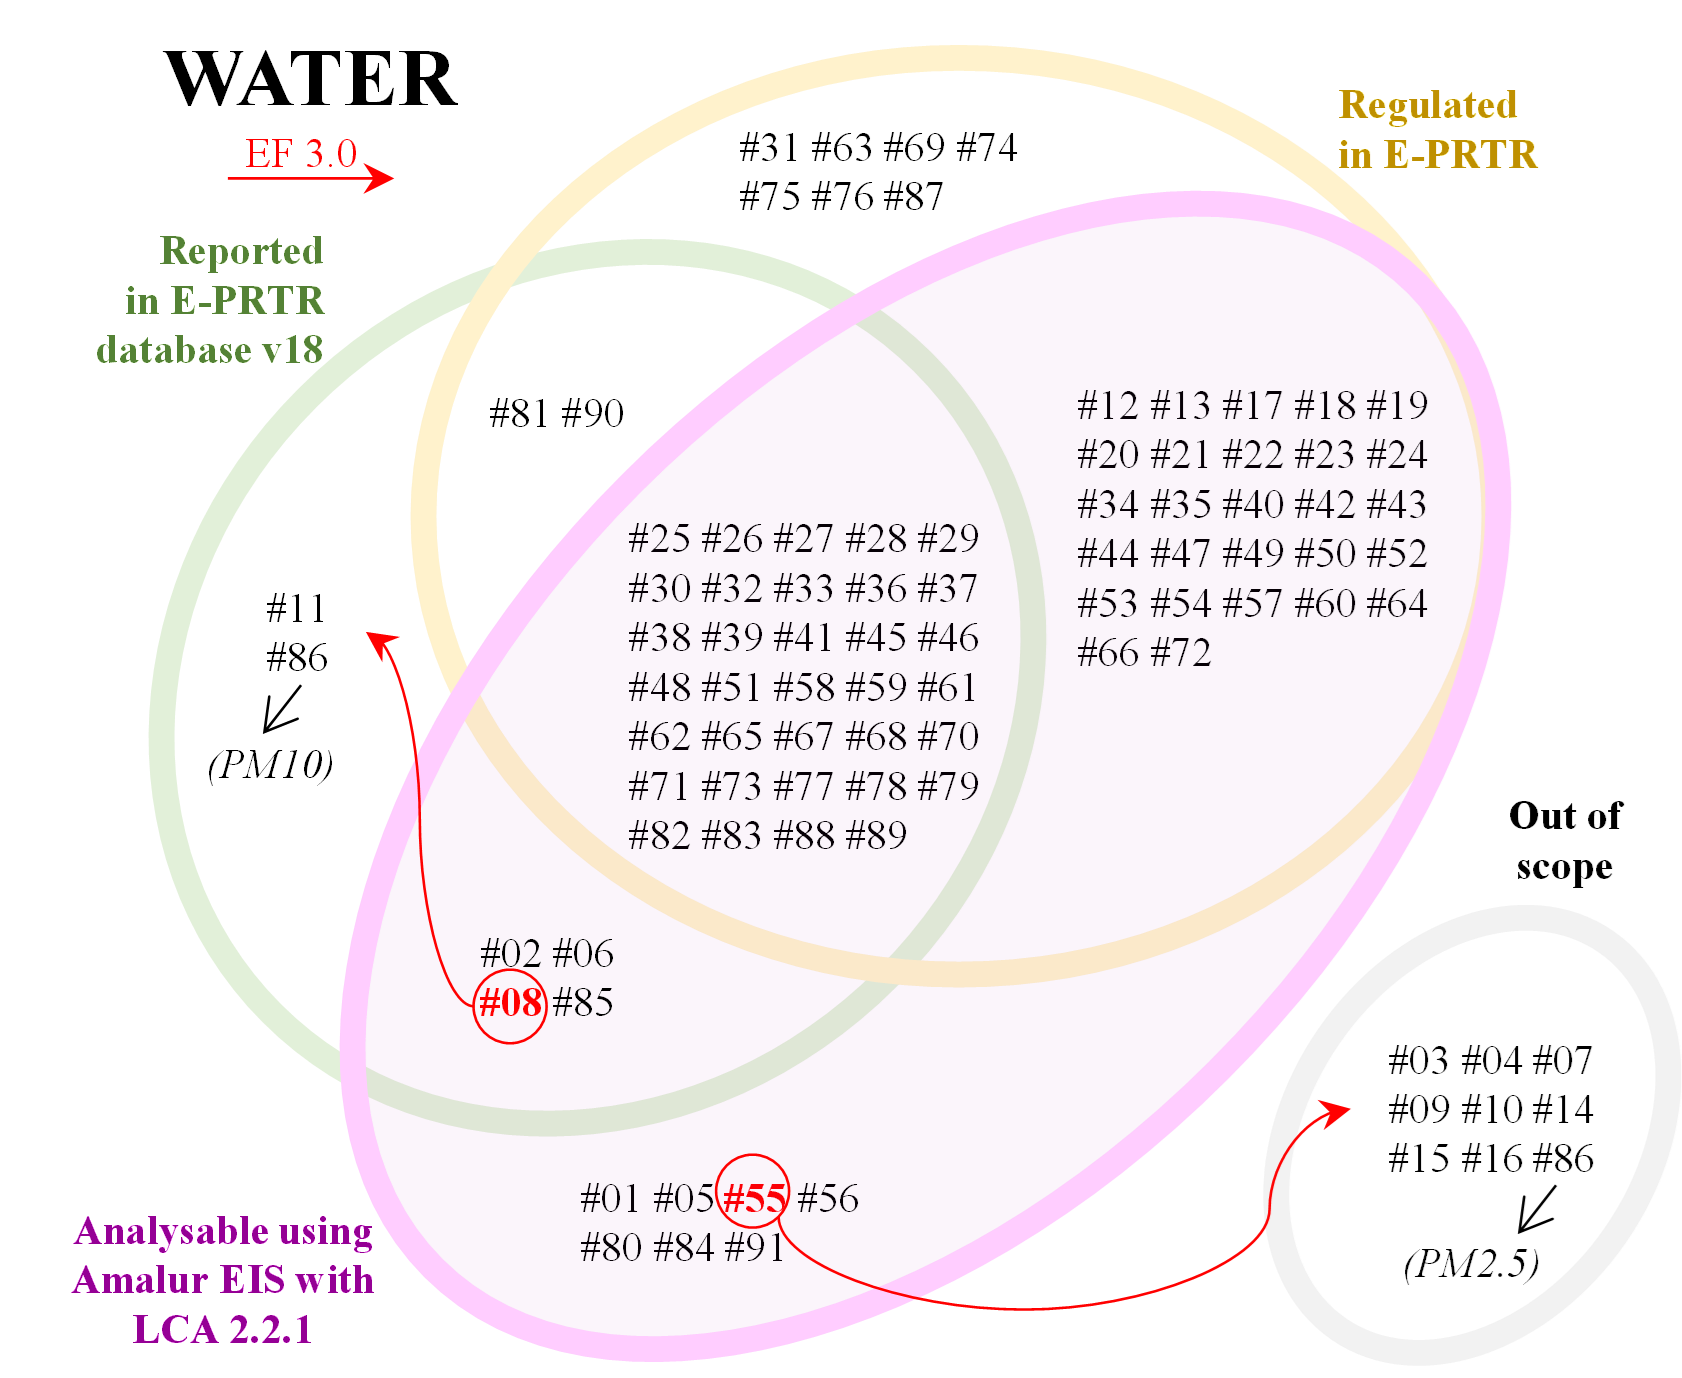
The system uses data on the releases into land, air and water of 31556 European industrial facilities for the period 2007–2021. Amalur EIS calculates environmental impacts of industrial releases using 31 life cycle impact assessment methods (LCIA) and covering 78 of the 91 pollutants regulated by the PRTR Protocol. The system has been constructed using a two-layer software infrastructure:
- a data layer supported by a relational database built in Postgres and
- a presentation layer built in Tableau, so it provides user-friendly access to the information.
For an illustrative analysis of the tool, the EF 3.0 LCIA method recommended by the European Commission was used, including normalisation and weighting steps for a better comparison. The analysis concludes that the climate change impact category contributes the most (68.6%) to the total impacts, while the largest contributor from an economic activity perspective is the energy sector (59.5%). Geographically, both elements coincide in the German regions of Düsseldorf, Köln and Brandenburg, resulting in the concentration of the largest impacts at the European regional level. In fact, Germany is the country with the highest impact (20.3% of total). Beyond this analysis, Amalur EIS is poised to be a valuable tool for tracking the transition towards sustainability, particularly in Europe.
All visualizations related to the data used in this article can be accessed from Visualizations.